


Creating a GeoChart using PHP and Google Charts API is a potent method for visualizing geographical data in an interactive and engaging manner. By combining PHP, a server-side scripting language, with the Google Charts API, developers can create dynamic GeoCharts that display display data on maps.
In this article, we’ll explore how to use PHP and the Google Charts API to create stunning GeoCharts.
Suggested Read: Generating Dynamic Line Charts & Graph Reports Using Chart.js and PHP
Easy Way to Create GeoChart Using PHP and Google Charts API
Let’s start by creating a basic GeoChart using PHP and the Google Charts API:
- Create a new PHP file (e.g., index.php) in your project directory.
- Add the below HTML code snippets in the file:
|
2 3 4 5 6 7 8 9 10 11 12 13 14 15 16 17 18 19 20 21 22 23 24 25 26 27 28 29 30 31 32 33 34 35 36 37 38 39 40 41 42 |
<!DOCTYPE html> <html> <head> <title>GeoChart Example</title> <!-- Load Google Charts API --> <script type="text/javascript" src="https://www.gstatic.com/charts/loader.js"></script> <script type="text/javascript"> google.charts.load('current', { 'packages': ['geochart'] }); google.charts.setOnLoadCallback(drawRegionsMap); function drawRegionsMap() { var data = google.visualization.arrayToDataTable([ ['Country', 'Popularity'], ['Germany', 200], ['United States', 300], ['Brazil', 400], ['Canada', 500], ['France', 600], ['RU', 700] ]); var options = { colorAxis: { colors: ['#FF0000', '#00FF00'] } }; var chart = new google.visualization.GeoChart(document.getElementById('chart_div')); chart.draw(data, options); } </script> </head> <body> <div id="chart_div" style="width: 900px; height: 500px;"></div> </body> </html> |
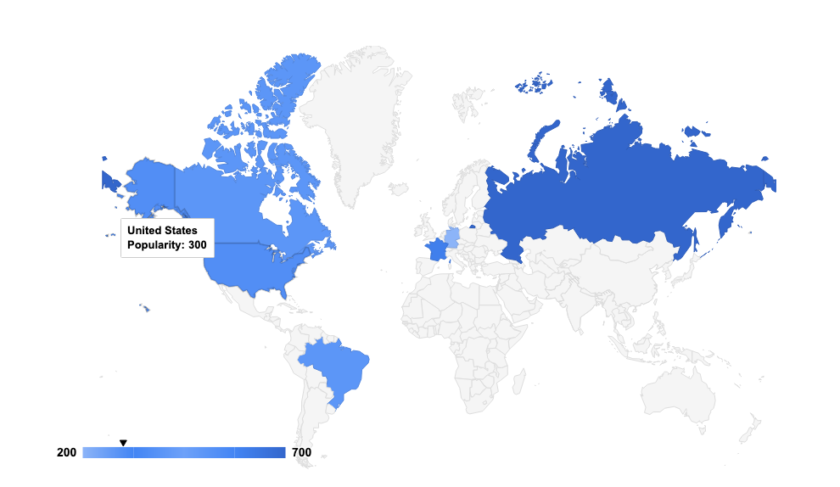
In the above code, a basic HTML page with a GeoChart rendered using the Google Charts API. The chart displays sample data for various countries with their corresponding popularity values.
Output

Are you want to get implementation help, or modify or extend the functionality?
A Tutorialswebsite Expert can do it for you.
Customizing the GeoChart
Now, let’s customize the GeoChart to display your own data:
- Replace the sample data in the data variable with your dataset. Ensure that the data is in the correct format: an array of arrays where each inner array contains the name of the country and its corresponding value.
- Adjust the options variable to customize the appearance of the chart. You can modify properties such as colors, tooltips, and more to suit your preferences.
Change inactive and active stroke color
To change the inactive and active stroke colors in a GeoChart, you’ll need to modify the options variable within the JavaScript code. Here’s how you can do it:
|
2 3 4 5 6 7 8 9 10 11 12 13 14 15 16 17 18 19 20 21 22 23 24 25 26 27 28 29 30 31 32 33 34 35 36 37 38 39 40 41 42 43 44 45 46 47 48 49 50 51 52 53 54 55 56 57 58 59 60 61 62 63 64 65 66 67 68 69 |
<script type="text/javascript" src="https://www.gstatic.com/charts/loader.js"></script> <script type="text/javascript"> google.charts.load('current', { 'packages': ['geochart'] }); google.charts.setOnLoadCallback(drawRegionsMap); function drawRegionsMap() { var data = google.visualization.arrayToDataTable([ ['Country', 'Popularity'], ['Germany', 200], ['United States', 300], ['Brazil', 400], ['Canada', 500], ['France', 600], ['RU', 700] ]); var options = { colorAxis: { colors: ['#8cb4f8','#4385f4','#6da1f9','#4385f4','#36c'] } }; var chart = new google.visualization.GeoChart(document.getElementById('chart_div')); /** remove hover border effect ***/ var container = document.getElementById('chart_div'); google.visualization.events.addListener(chart, 'ready', function () { // change inactive stroke color var countries = container.getElementsByTagName('path'); Array.prototype.forEach.call(countries, function (path) { path.setAttribute('stroke', '#f6f6f6'); }); // change active stroke color, build mutation observer var observer = new MutationObserver(function (nodes) { Array.prototype.forEach.call(nodes, function(node) { // check for new nodes if (node.addedNodes.length > 0) { Array.prototype.forEach.call(node.addedNodes, function(addedNode) { // the tooltip element will also be here, we only want the group elements if (addedNode.tagName === 'g') { // find children of the group element Array.prototype.forEach.call(addedNode.childNodes, function(childNode) { // check for path element, change stroke if (childNode.tagName === 'path') { childNode.setAttribute('stroke', '#f6f6f6'); } }); } }); } }); }); // activate mutation observer observer.observe(container, { childList: true, subtree: true }); }); /**** end hover effect code here ******/ chart.draw(data, options); } </script> |
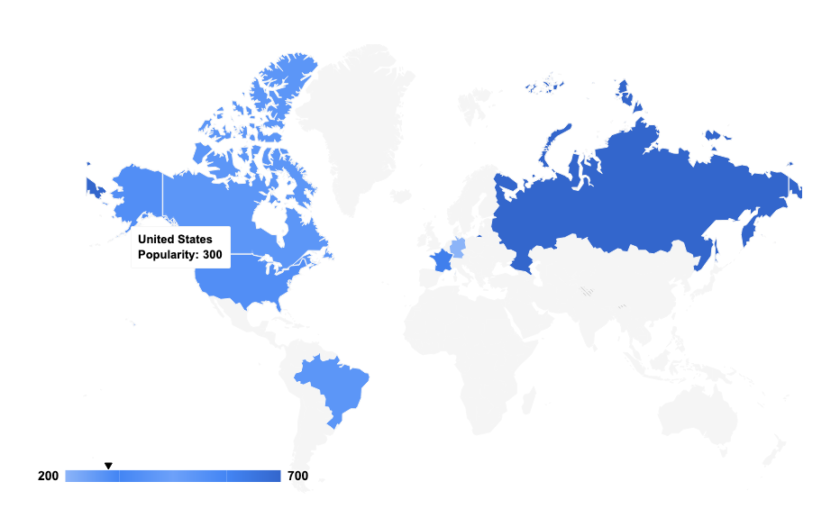
This JavaScript code is using a MutationObserver to detect changes in the DOM and modify the stroke color of both inactive and active regions in a GeoChart.

Wrapping Words
In this tutorial, we’ve explored how to create interactive GeoCharts using PHP and the Google Charts API. Experiment with different datasets and customization options to create GeoCharts that suit your project requirements.
Thanks for reading 🙏, I hope you found this tutorial helpful for your project. Keep learning! If you face any problems – I am here to solve your problems.
FAQs
A GeoChart is a type of chart used to visualize geographical data on a map. It represents data points by shading or coloring regions, such as countries or states, according to the data values associated with them.
PHP is a powerful server-side scripting language, while the Google Charts API offers a user-friendly way to create interactive charts and maps. Combining these technologies allows developers to generate dynamic GeoCharts that fetch and display data from various sources, making it ideal for web applications.
One limitation is that GeoCharts rely on data provided by developers, so the accuracy and relevance of the displayed information depend on the quality of the data source. Additionally, rendering large datasets may impact performance, so it’s essential to optimize data processing.
Yes, GeoCharts created using PHP and Google Charts API can be seamlessly integrated into PHP-based web applications. By embedding GeoChart code within PHP files, developers can incorporate dynamic maps into their projects.


Pradeep Maurya is the Professional Web Developer & Designer and the Founder of “Tutorials website”. He lives in Delhi and loves to be a self-dependent person. As an owner, he is trying his best to improve this platform day by day. His passion, dedication and quick decision making ability to stand apart from others. He’s an avid blogger and writes on the publications like Dzone, e27.co